Exponential Moving Average (EMA)
Definition & how to use this technical indicator for quantitative investing
An Exponential Moving Average (EMA) is a technical indicator that is often used in financial analysis and trading. Its use cases and calculations are very similar to Simple Moving Averages (SMA) but with an added variable of weights.
Unlike Simple Moving Averages which give equal weight to every period, Exponential Moving Averages give higher weights to the most recent periods, as to better reflect the latest price action.
Exponential moving averages can be used in various ways, including:
- Trend Identification: Moving averages can help identify the overall trend of a security by smoothing out fluctuations in the price.
- Support and Resistance: Moving averages can act as support or resistance levels, as they provide a visual representation of the average price of a security over a given time period.
- Buy and Sell Signals: Moving averages can be used to generate buy and sell signals by combining them with other technical indicators or chart patterns.
- Momentum Indicator: Moving averages can be used as a momentum indicator, which measures the rate of change in the price of a security.
How SMA works & sample calculations
To get a better understanding of EMA and how it differs from an SMA, let’s look at an example of each using a 5-day moving average for Apple stock (ticker $AAPL).
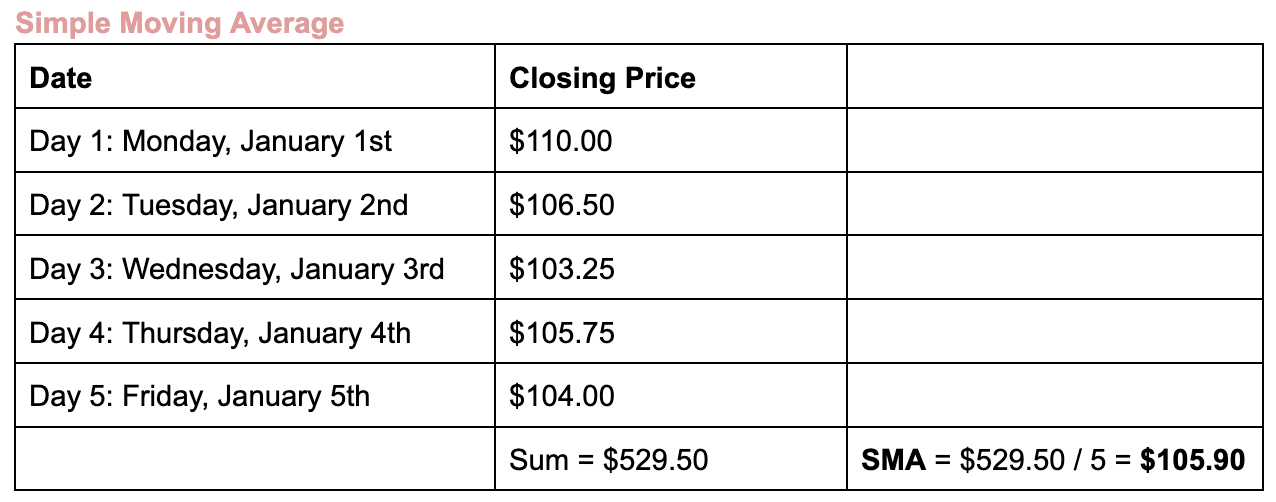
To calculate the 5-day SMA as of market close on January 5th, add up the previous closing prices from the last 5 trading days ($110.00 + $106.50 + $103.25 + $105.75 + $104.00 = $529.50) and divide the result by 5 ($529.50 / 5 = $105.90). So at market close on January 5th, Apple’s SMA was $105.90.
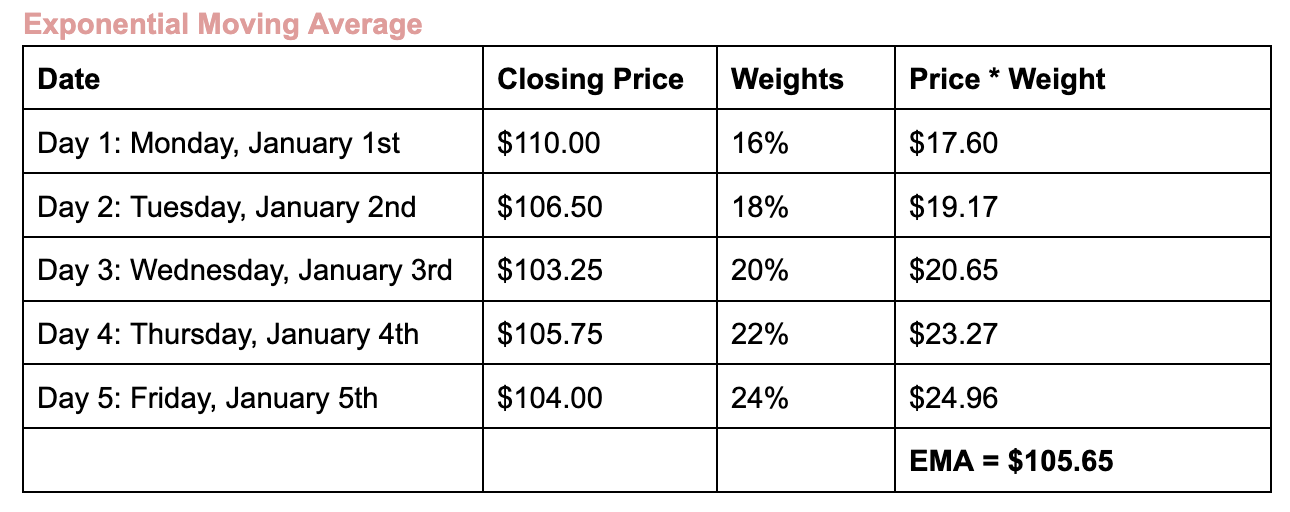
Notice how Day 5’s weight is 24%, while Day 1’s weight is only 16%. As mentioned earlier, EMAs give higher weights to the most recent data to better reflect the latest price trends.
To calculate the 5-day EMA as of market close on January 5th, multiply each closing price by their respective weight to find their weighted price (($110.00 * 0.16) + ($106.50 * 0.18) + etc…). Then sum up the weighted prices to find the weighted average ($17.60 + $19.17 + $20.65 + $23.27 + $24.96 = $105.65). So at market close on January 5th, Apple’s EMA was $105.65.
Now let’s look at the Apple stock over 50 days and graph the EMA line with the SMA as well as the underlying stock price. The blue line below represents Apple’s hypothetical closing price each day, for 50 days. The red line below represents the 5-day SMA, while the yellow line represents the 5-day EMA.
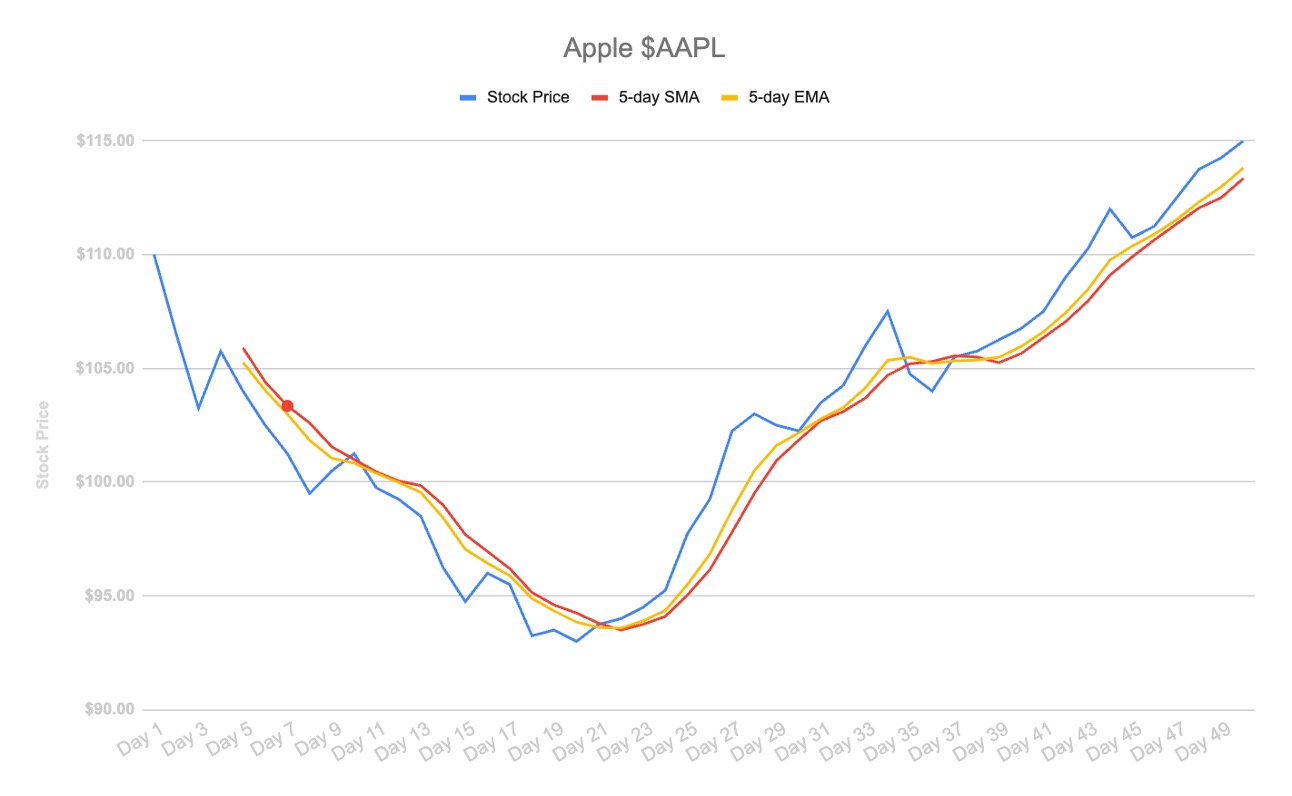
Between day 5 and day 24, the yellow EMA line is sloping down; this signifies that the underlying stock is in a downtrend. Conversely, between day 24 and day 50, the EMA line is sloping up; this signifies that Apple’s stock is in an uptrend.
You can use almost any period of time with exponential moving averages; 5-day, 14-day, 20-day, 50-day, 200-day, or even longer periods like 50-week, and even 50-month. The longer the period, the slower the EMA line will react to recent changes in the stock price. The most common periods are the 50-day and 200-day EMAs.
Technical analysis & quantitative trading with EMA
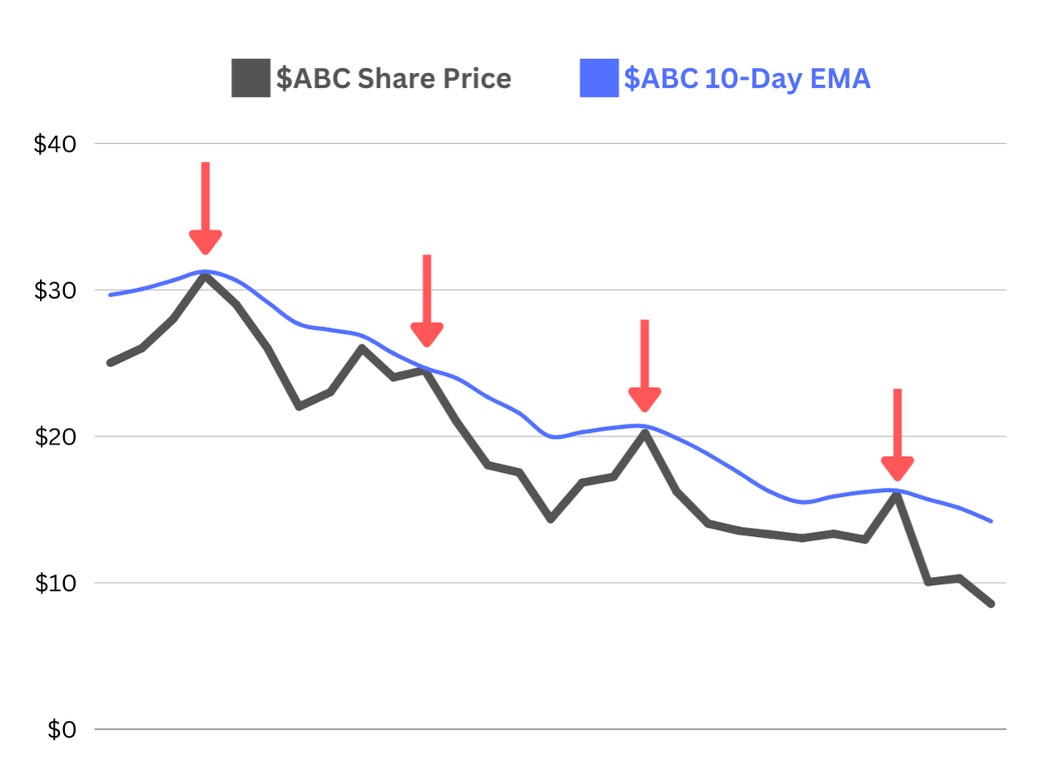
Support & Resistance
Traders commonly use EMA lines as either potential support or resistance for the underlying asset price. If a stock is in a downtrend and bounces back up to a significant EMA line, there may be some price resistance, and vice versa.
Let’s look at an example. Below is a hypothetical graph of ABC Corp’s stock (ticker $ABC). The grey line represents their share price, while the blue line represents the 10-day EMA. As you can see, shares of ABC Corp trended down during this period, and when looking to rally back, it was rejected at its 10-day EMA on four separate occasions!
Crossovers
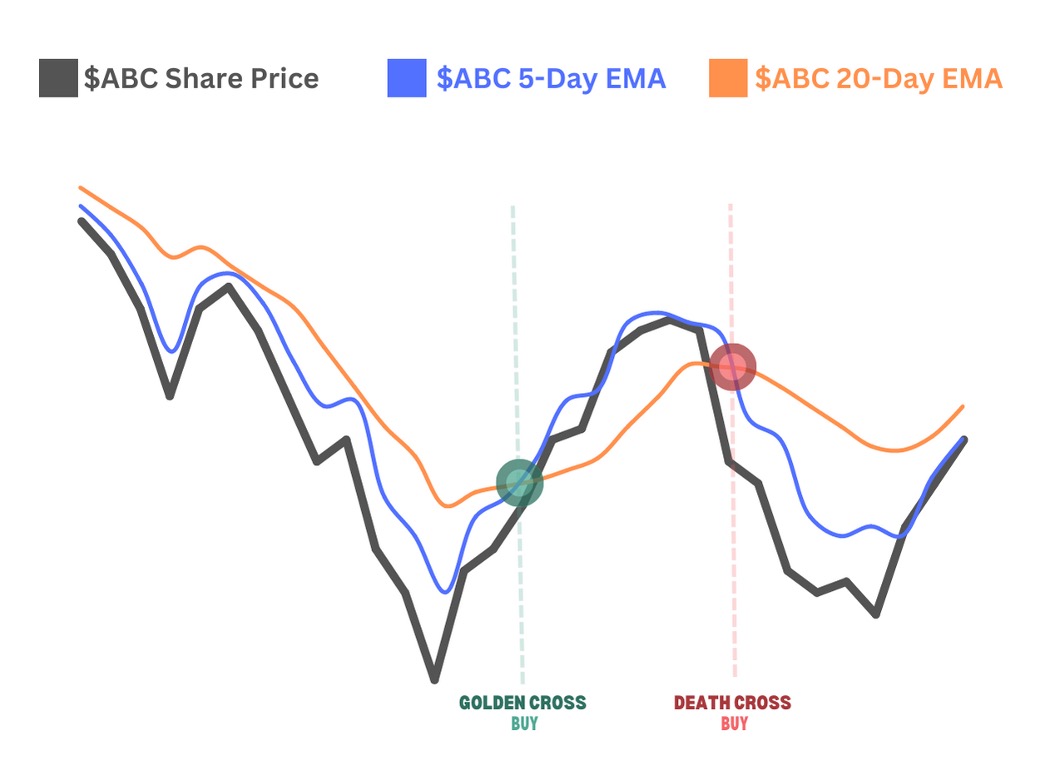
Traders often use EMA crossovers, such as the death cross and golden cross, to identify potential trading signals. To trade using crossovers, you need two EMAs with offsetting periods such as a 5-day EMA and a 20-day EMA. As the name sounds, you enter or exit a position when the two EMAs crossover.
Golden Cross = shorter-term EMA crosses above the longer-term EMA. This is typically a signal to buy, as it could be the early stages of a reversal to an uptrend.
Death Cross = shorter-term EMA crosses below the longer-term EMA. This is typically a signal to sell, as it could be the early stages of a reversal to a downtrend.
Let’s look at an example…Below is another hypothetical graph of ABC Corp . The blue line is the 5-day EMA (shorter-term) and the orange line is the 20-day EMA (longer-term). The green circle plotted on the graph displays where a golden cross has occurred, and represents an opportunity to enter a long position. The red circle, on the other hand, displays where a death cross has occurred, and represents a potential spot to exit a long position.
Limitations
Is the EMA perfect? No. Like most technical indicators, it has plenty of limitations. For starters, it relies on historical data which may not reflect current market conditions accurately and nothing about the calculation is predictive in nature. At times, the market seems to respect EMA support and resistance lines, and at other times, it shows these indicators no consideration. That’s one reason why traders like to use multiple indicators at the same time, so that they can be more confident in their decisions and trades.
Closing
Overall, EMA is a valuable tool for traders to understand the price trends of assets and make informed investment decisions based on historical price data. Please check out the Alpha Vantage Technical Indicator APIs to access 50+ technical indicators programmatically with ease.