Relative Strength Index (RSI)
Definition & how to use this technical indicator for quantitative investing
The relative strength index (RSI) is a momentum indicator and one of the most commonly used technical indicators for trading. It measures the speed and strength of the recent price movements to evaluate if the asset could be overvalued or undervalued, and when it could be due for a reversal. The index is an oscillator that ranges from 0 to 100, with a reading under 30 signaling oversold conditions, whereas a reading over 70 signals overbought conditions.
- The RSI provides traders with information about price momentum and is typically plotted below the underlying asset price graph.
- The indicator oscillates between 0 to 100
- A reading >70 signals overbought, whereas <30 signals oversold
- The RSI crossing above the overbought line is typically viewed as a sell signal, whereas a crossing below the oversold line is viewed as a buy signal
- The indicator works best in trading ranges
How RSI works & sample calculations
The RSI compares the strength of a security’s price movement on up days to that of down days. The index will rise as the number and size of up days increase. Similarly, it will fall as the number and size of down days increase. For mathematical reference, please refer to this article.
The RSI indicator is typically plotted beneath an asset’s price chart, as shown below.
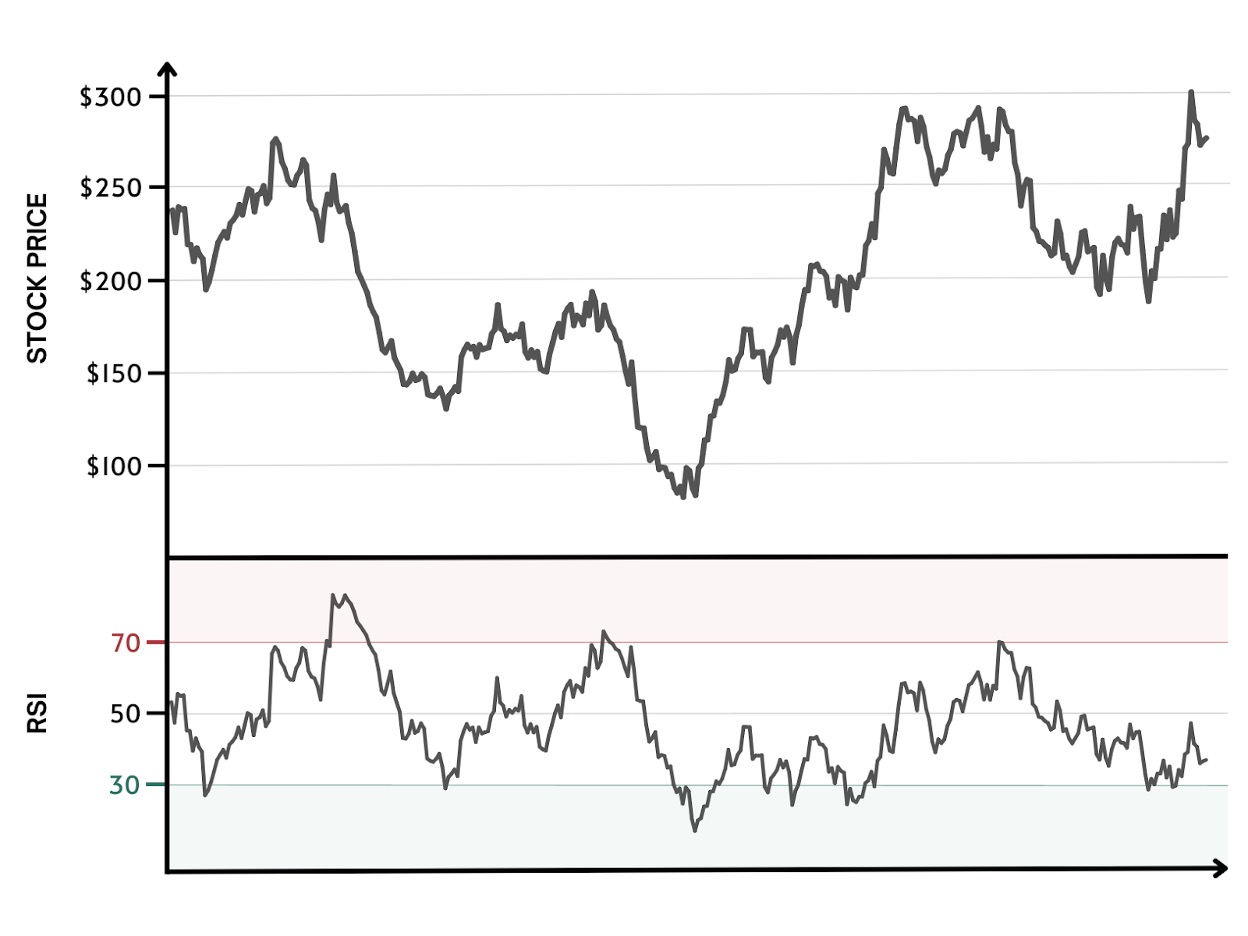
Typically, when the RSI crosses above 70 it indicates that the asset may be overbought whereas when it crosses below 30, it indicates the asset may be oversold.
As depicted in the chart above, the RSI has the tendency to remain in the overbought zone for extended durations during an upward trend in a stock's price. Conversely, it can also linger in the oversold zone for extended periods when the stock is in a downtrend. That is why understanding how to use the indicator in alignment with the current trend can help to alleviate these concerns.
Technical analysis & quantitative trading with RSI
Using the same example from above, let’s now plot on the graph where the RSI first crosses above 70 or below 30.
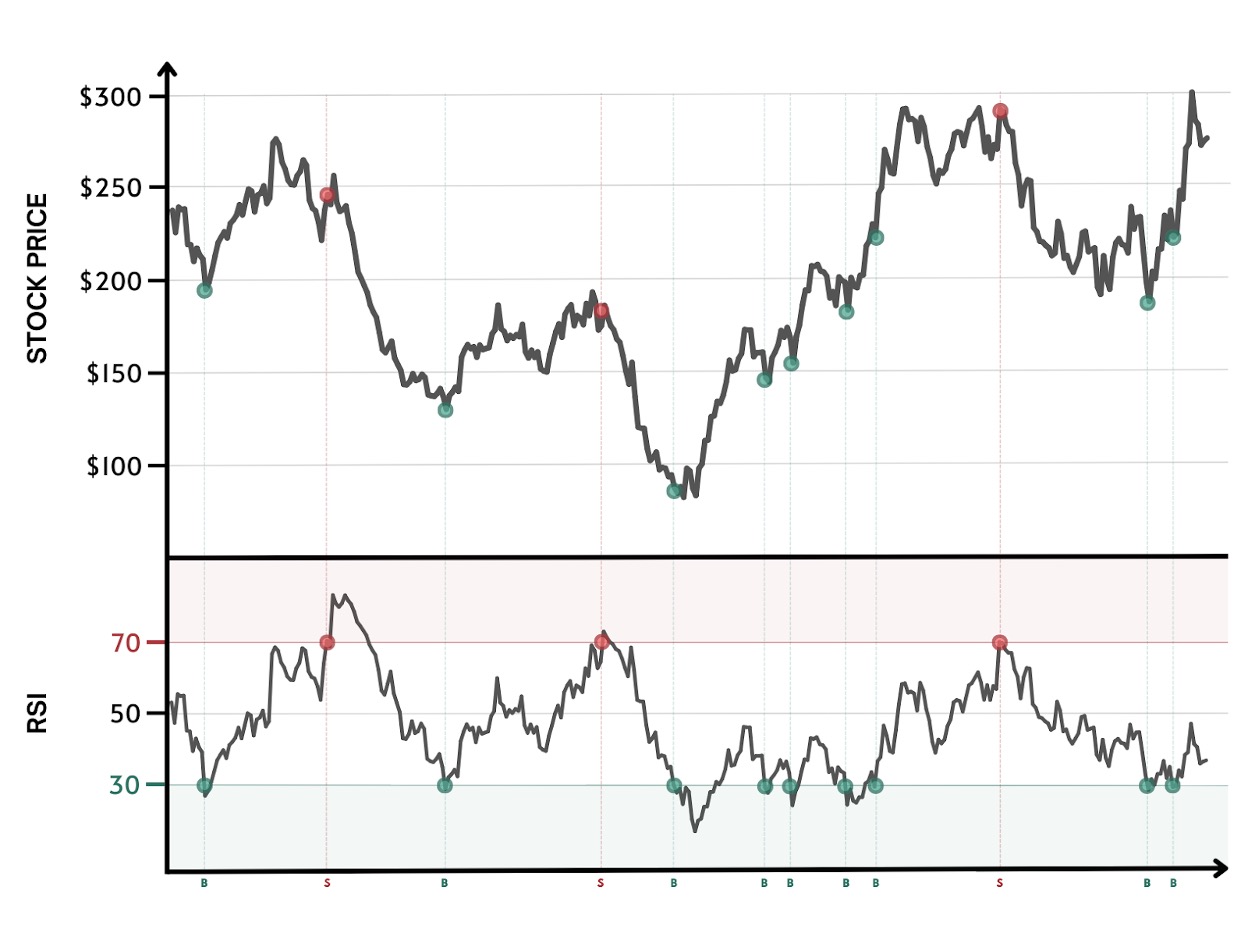
When the RSI crosses below 30 and indicates the asset is oversold, traders typically use that as a signal to buy the underlying asset. Likewise, when the RSI crosses above 70 and indicates the asset is overbought, traders use that as a sell signal for the security. In the example above, the RSI did a fairly good job picking entry and exit points for trades.
Limitations
Is the RSI a perfect indicator? Does it always signal the top and bottom of price trends? No. The RSI simply compares the strength and speed of recent price movements and suggests when the asset may be overbought or oversold. The indicator can trade in the overbought or oversold range for a while when an asset has significant momentum in either direction. Like most technical indicators, its signals are most reliable when they conform to the long-term trend.
False alarms, such as when the RSI signals oversold and yet the underlying security’s price continues to dip, certainly happen and can be costly if you solely rely on just the RSI as a standalone indicator. That’s why many traders like to use the RSI in conjunction with other indicators such as Simple Moving Averages (SMA) or Exponential Moving Averages (EMA), so that they can be more confident in their decisions and trades.
Closing
Overall, the RSI is a valuable tool for traders to understand the price trends of assets and make informed investment decisions. Please check out the Alpha Vantage Technical Indicator APIs to access 50+ technical indicators programmatically with ease.